
 gosuccessbusiness
 Marketing reporting is an essential part of any marketing strategy. It allows you to measure the performance of your marketing campaigns and make informed decisions about future spending and strategy. In this blog, we’ll provide you with some examples of marketing reports and how to build and analyze them.
- Campaign Performance Report
Campaign performance reports are used to track the performance of individual marketing campaigns. These reports typically include information such as campaign objectives, target audience, budget, dates, and metrics such as impressions, clicks, conversions, and ROI.
To build a campaign performance report, start by defining the campaign objectives and targets. Then, collect data on the campaign’s performance, including impressions, clicks, conversions, and ROI. Analyze the data to determine if the campaign met its objectives and calculate ROI to determine if the campaign was cost-effective.
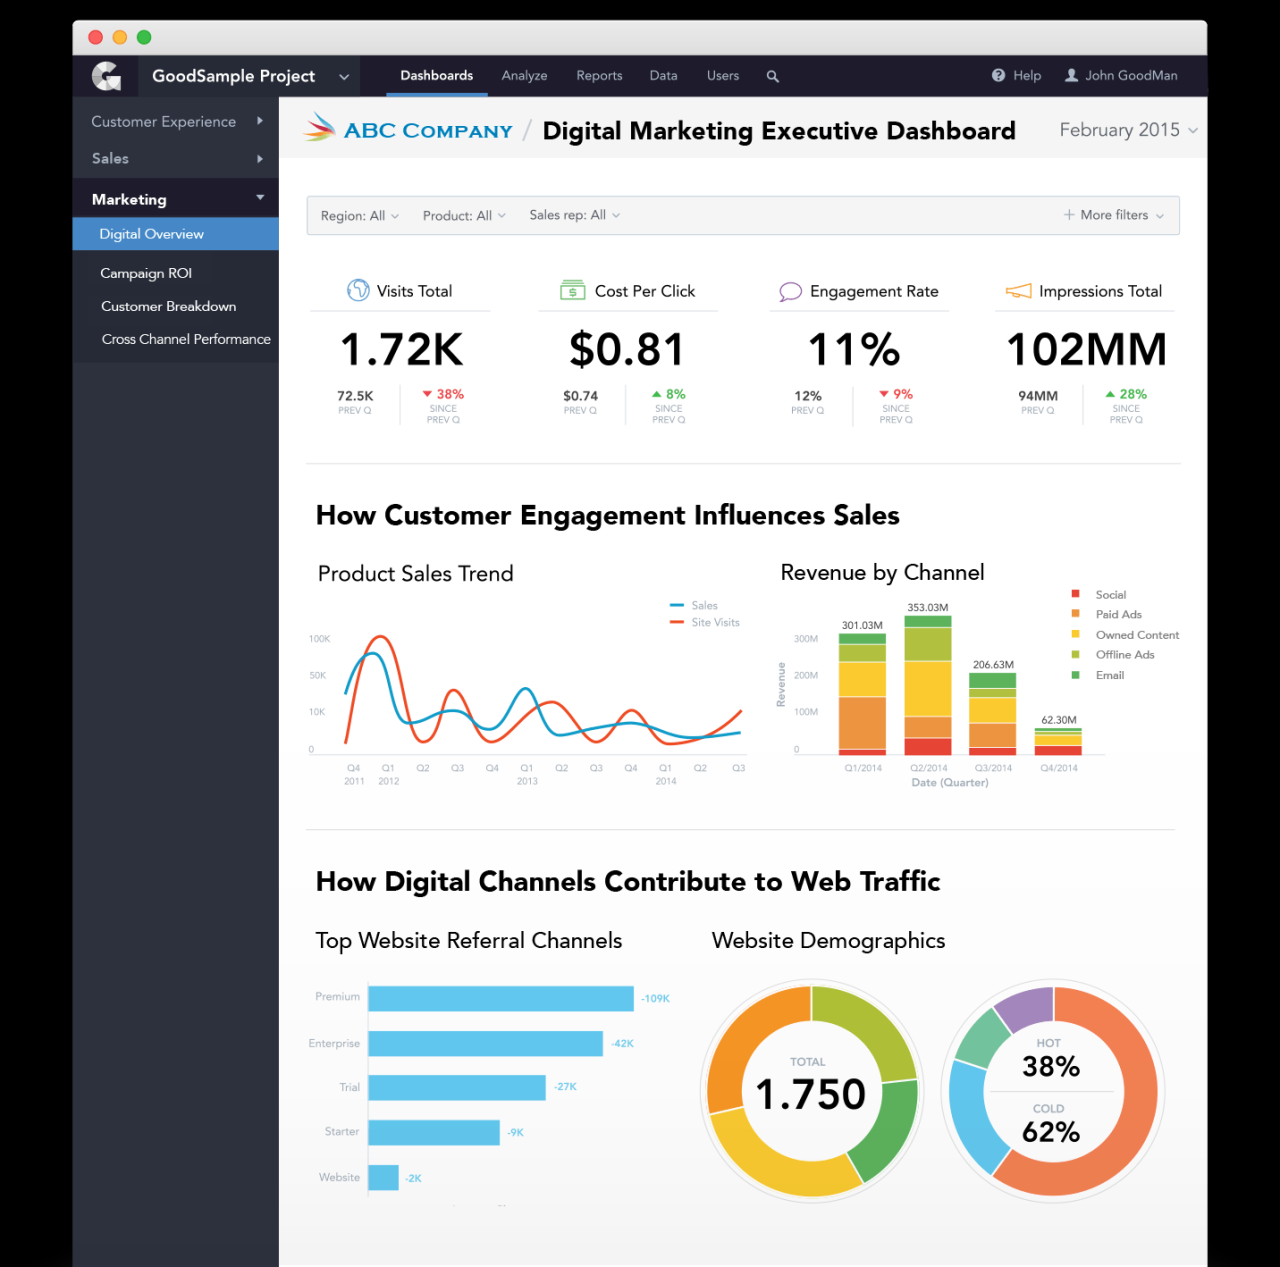
- Sales Report
Sales reports are used to track the revenue generated by different marketing campaigns. These reports typically include information such as product sales, revenue, margins, and the number of customers.
To build a sales report, start by collecting data on product sales and revenue. Then, calculate margins and identify trends in sales and revenue. Analyze the data to identify opportunities for increasing sales and revenue.
- Customer Report
Customer reports are used to track customer engagement and loyalty. These reports typically include information such as customer demographics, preferences, behavior patterns, and feedback.
To build a customer report, start by collecting data on customer demographics and preferences. Then, analyze customer behavior patterns and feedback to identify opportunities for improving customer engagement and loyalty. Use this information to develop targeted marketing strategies to increase customer engagement and loyalty.
- Market Research Report
Market research reports are used to gain insights into consumer behavior, market trends, and competitive landscapes. These reports typically include information such as market size, growth trends, customer needs, and competitive analysis.
To build a market research report, start by defining your market and research objectives. Then, collect data through surveys, interviews, and secondary research to understand market trends, customer needs, and competitive landscapes. Analyze the data to identify opportunities and challenges in the market. Use this information to develop a competitive marketing strategy that meets consumer needs and takes advantage of market trends.
In conclusion, marketing reporting is an essential part of any marketing strategy. It allows you to measure the performance of your marketing campaigns and make informed decisions about future spending and strategy. By building and analyzing these examples of marketing reports, you can gain insights into your campaigns’ performance, sales opportunities, customer engagement, market trends, and competitive landscapes. Use this information to develop targeted marketing strategies that meet consumer needs and increase ROI.